Dashboard
Open Dashboard from the top bar (#/home) after login.
Global data
Summary cards show your warehouse at a glance:
- Number of products and total quantity in stock
- Out of stock — click to open the filtered product list
- Total selling price (per currency)
- Last stock change and today’s date
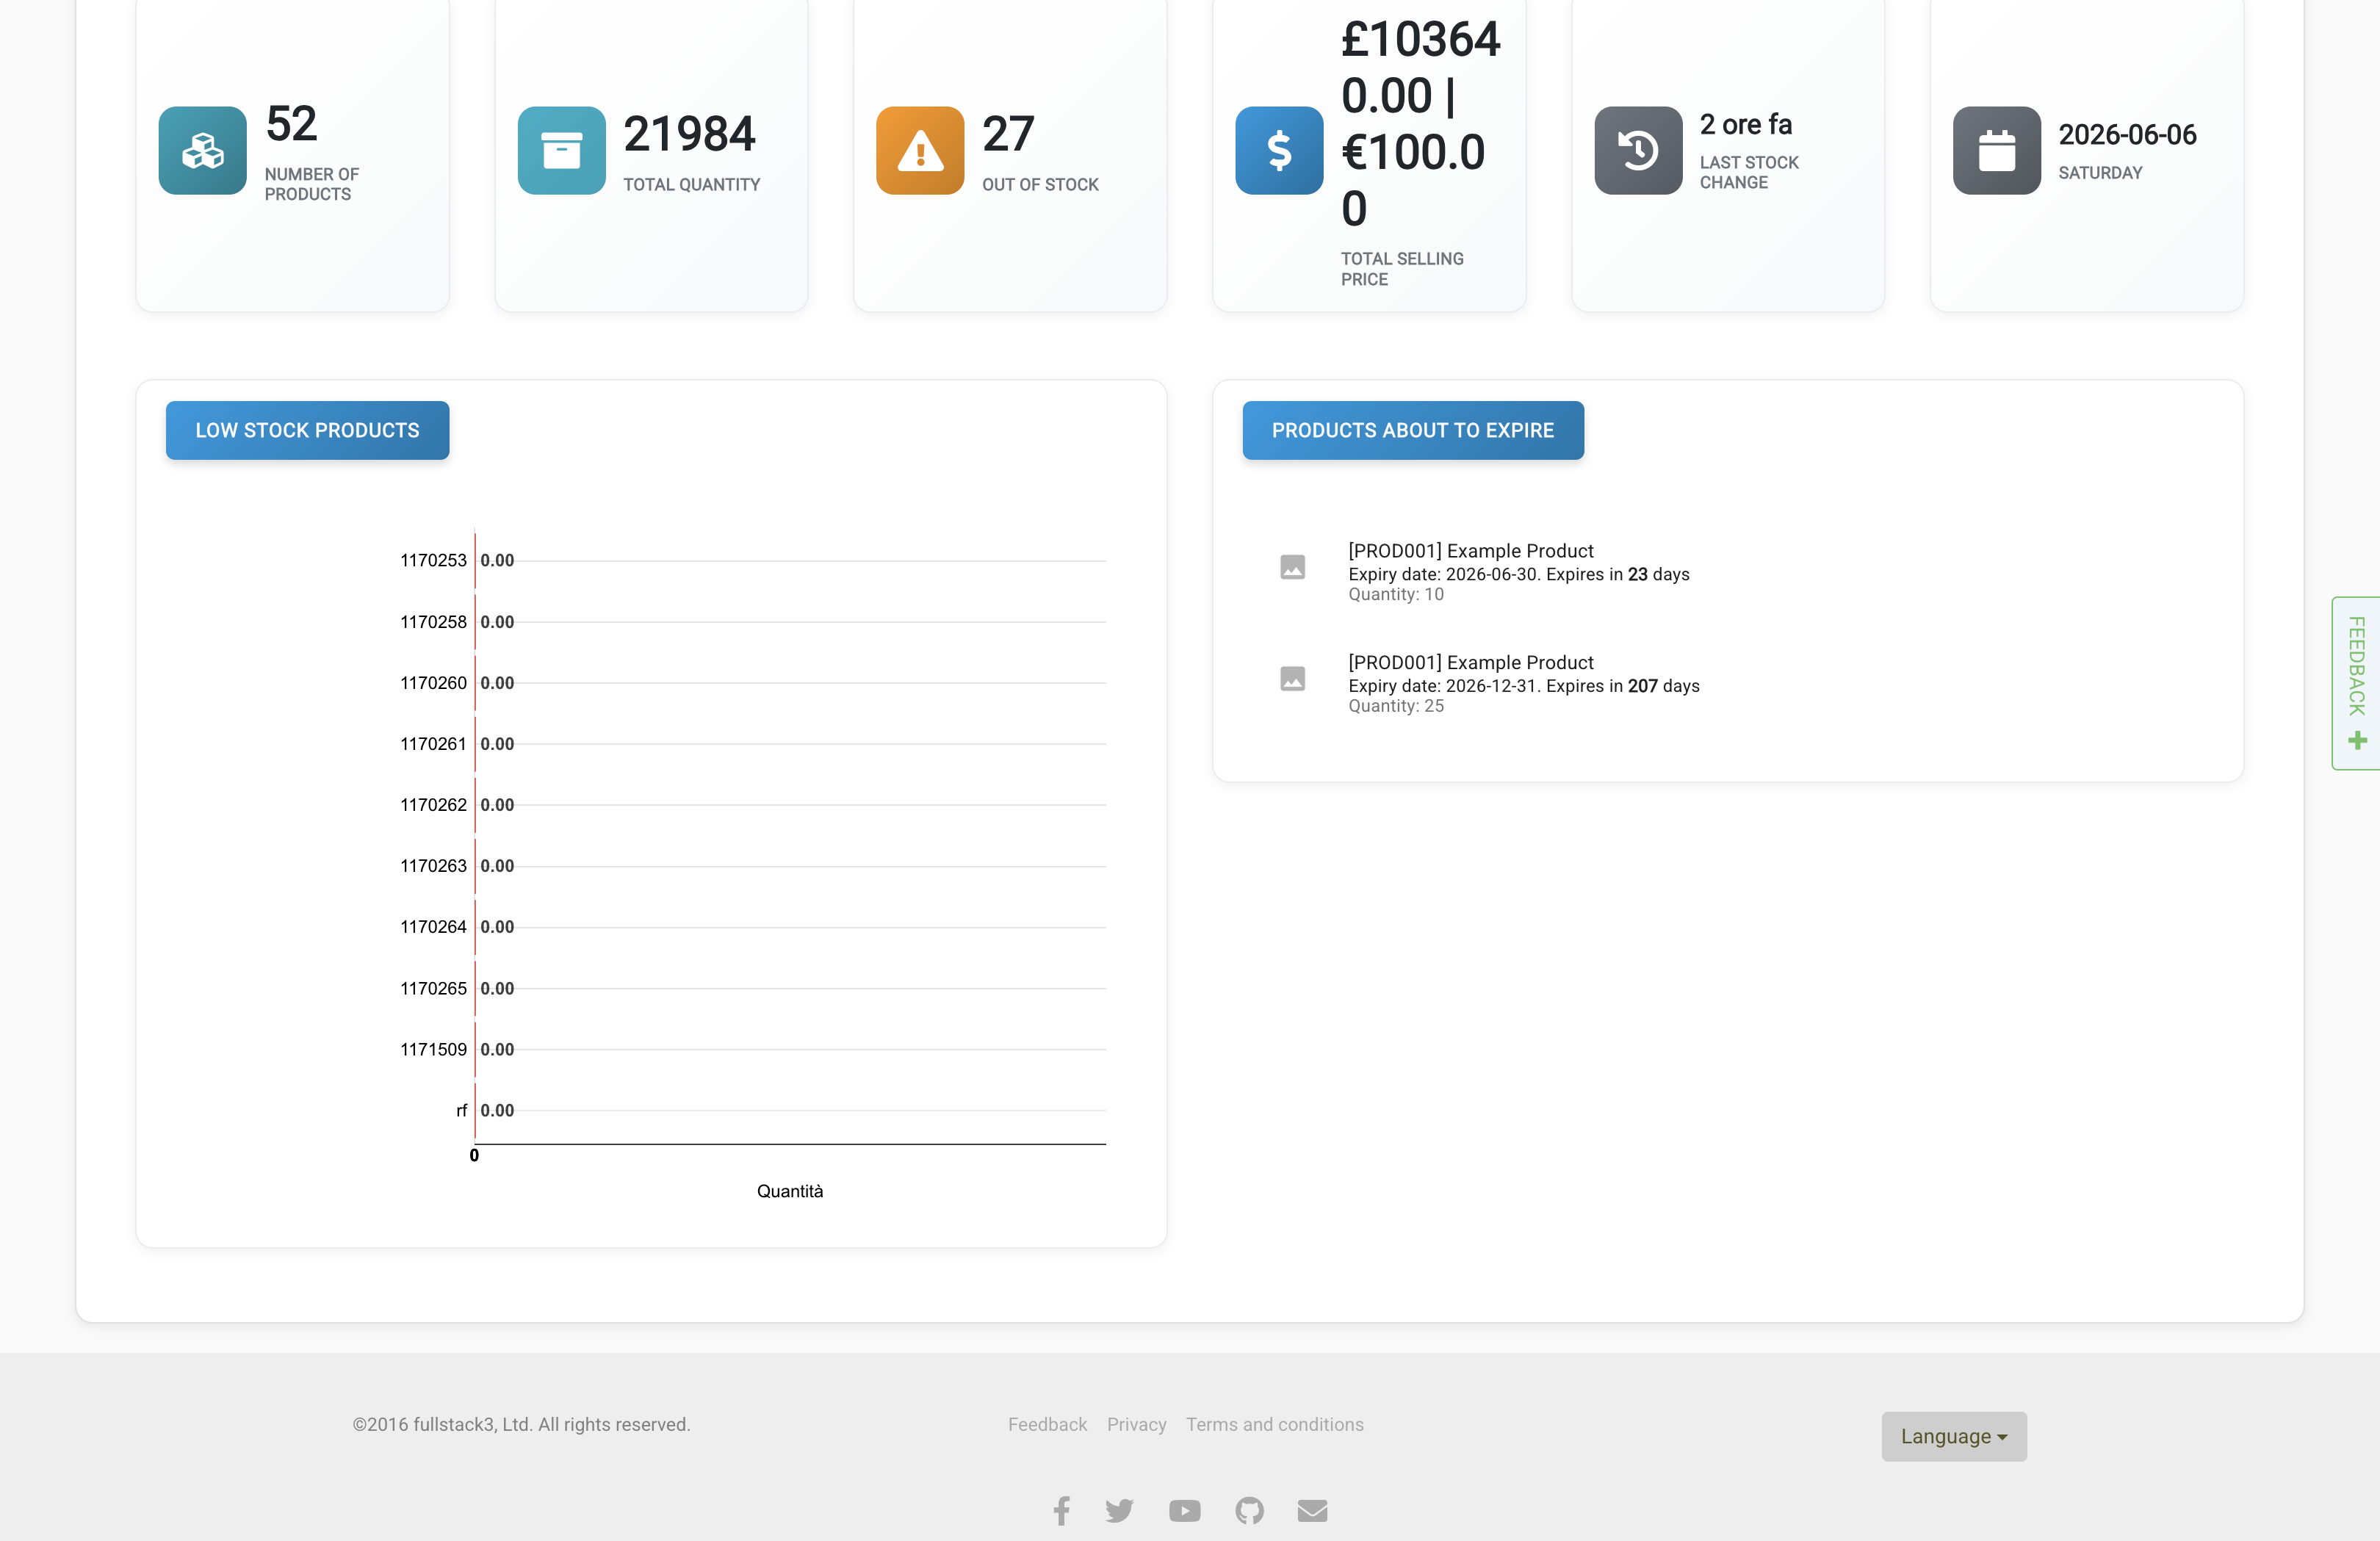
Below that you may see low stock charts, products about to expire (when the Expiry dates module is on), and other widgets.
Selected interval
Use the date picker to analyse stock movements and sales for a period (today, yesterday, last 7 days, or custom range):
- Selling price, purchase price, stock in/out quantities
- Charts for products and movements in/out
- Sales orders totals and trends (when the Sales order module is on)
Change the interval and click the arrow to refresh the analytics.