Dashboard and reports
The Dashboard is the home page of the web app. It summarises stock activity and, when enabled, sales performance.
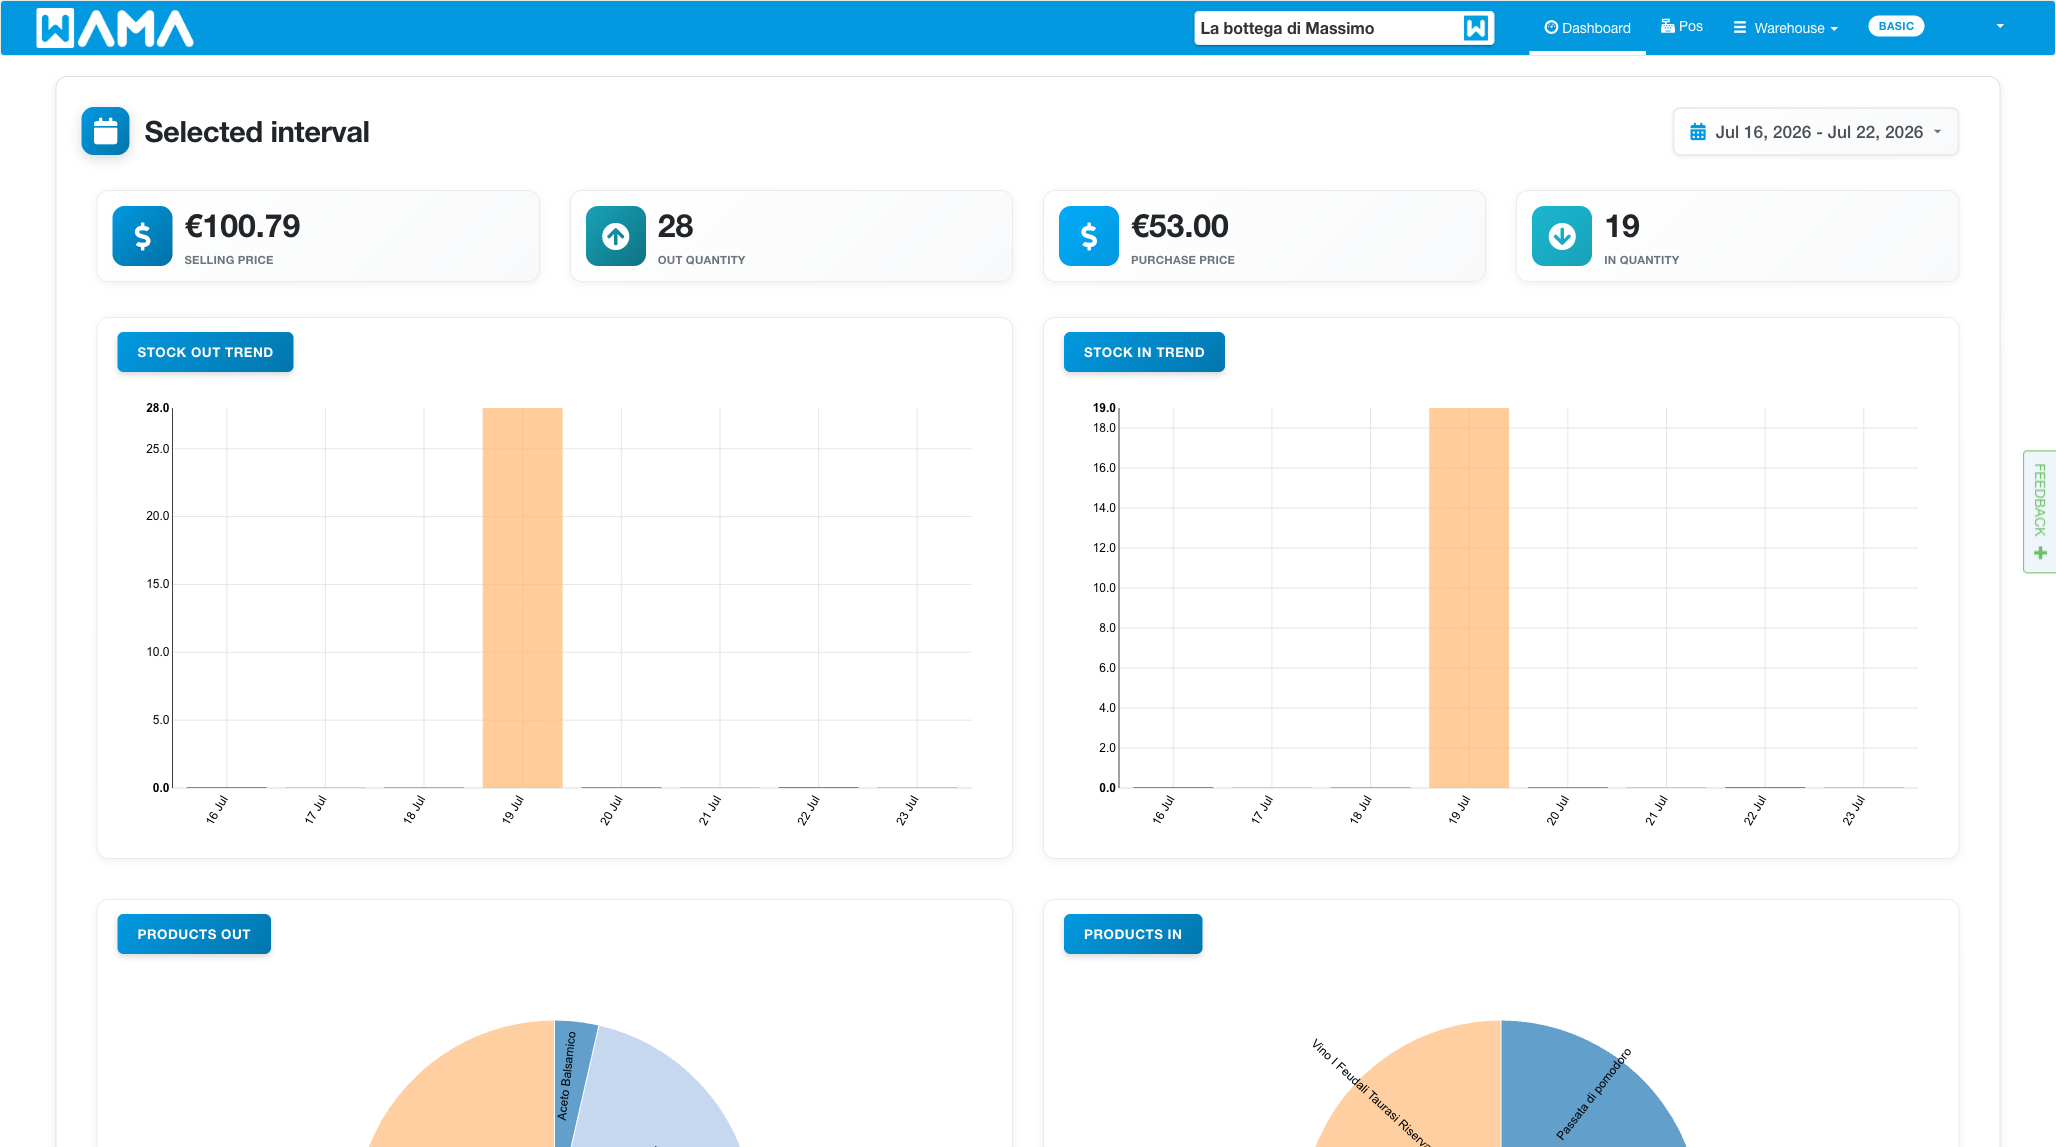
Date range
Select the period used for the charts and period KPIs: Today, Yesterday, Last 7 days, or a custom range.
Warehouse overview
Global figures for the current point of sale include:
- Number of products
- Total quantity
- Out of stock
- Total selling price
- Last stock change
Period KPIs include Selling price, Out quantity, Purchase price, and In quantity, with stock in/out trend charts.
Sales (Sales orders module)
When the Sales orders module is active, the dashboard also shows sales totals, averages, charts, and Sales orders per employee.
Low stock products
On the dashboard, Low stock products lists products whose quantity is less than or equal to the Reorder threshold (up to 20). Use View all low stock products to see the full list.
Set the reorder threshold on each product. See Products.
Products about to expire
When the Expiry dates module is active, the dashboard shows Products about to expire (up to 20): products with stock that are past expiry or within the alert threshold configured in the module settings.
See Expiry dates.
Note
Android app: The Android Dashboard shows similar KPIs and charts; low-stock and expiry panels are available on the web dashboard only.