Dashboard and reports
The Dashboard is the home page of the web app. It summarises sales, profit, warehouse health, and stock movements for the current point of sale. Open Reports in the main menu for full tables, filters, and CSV export.
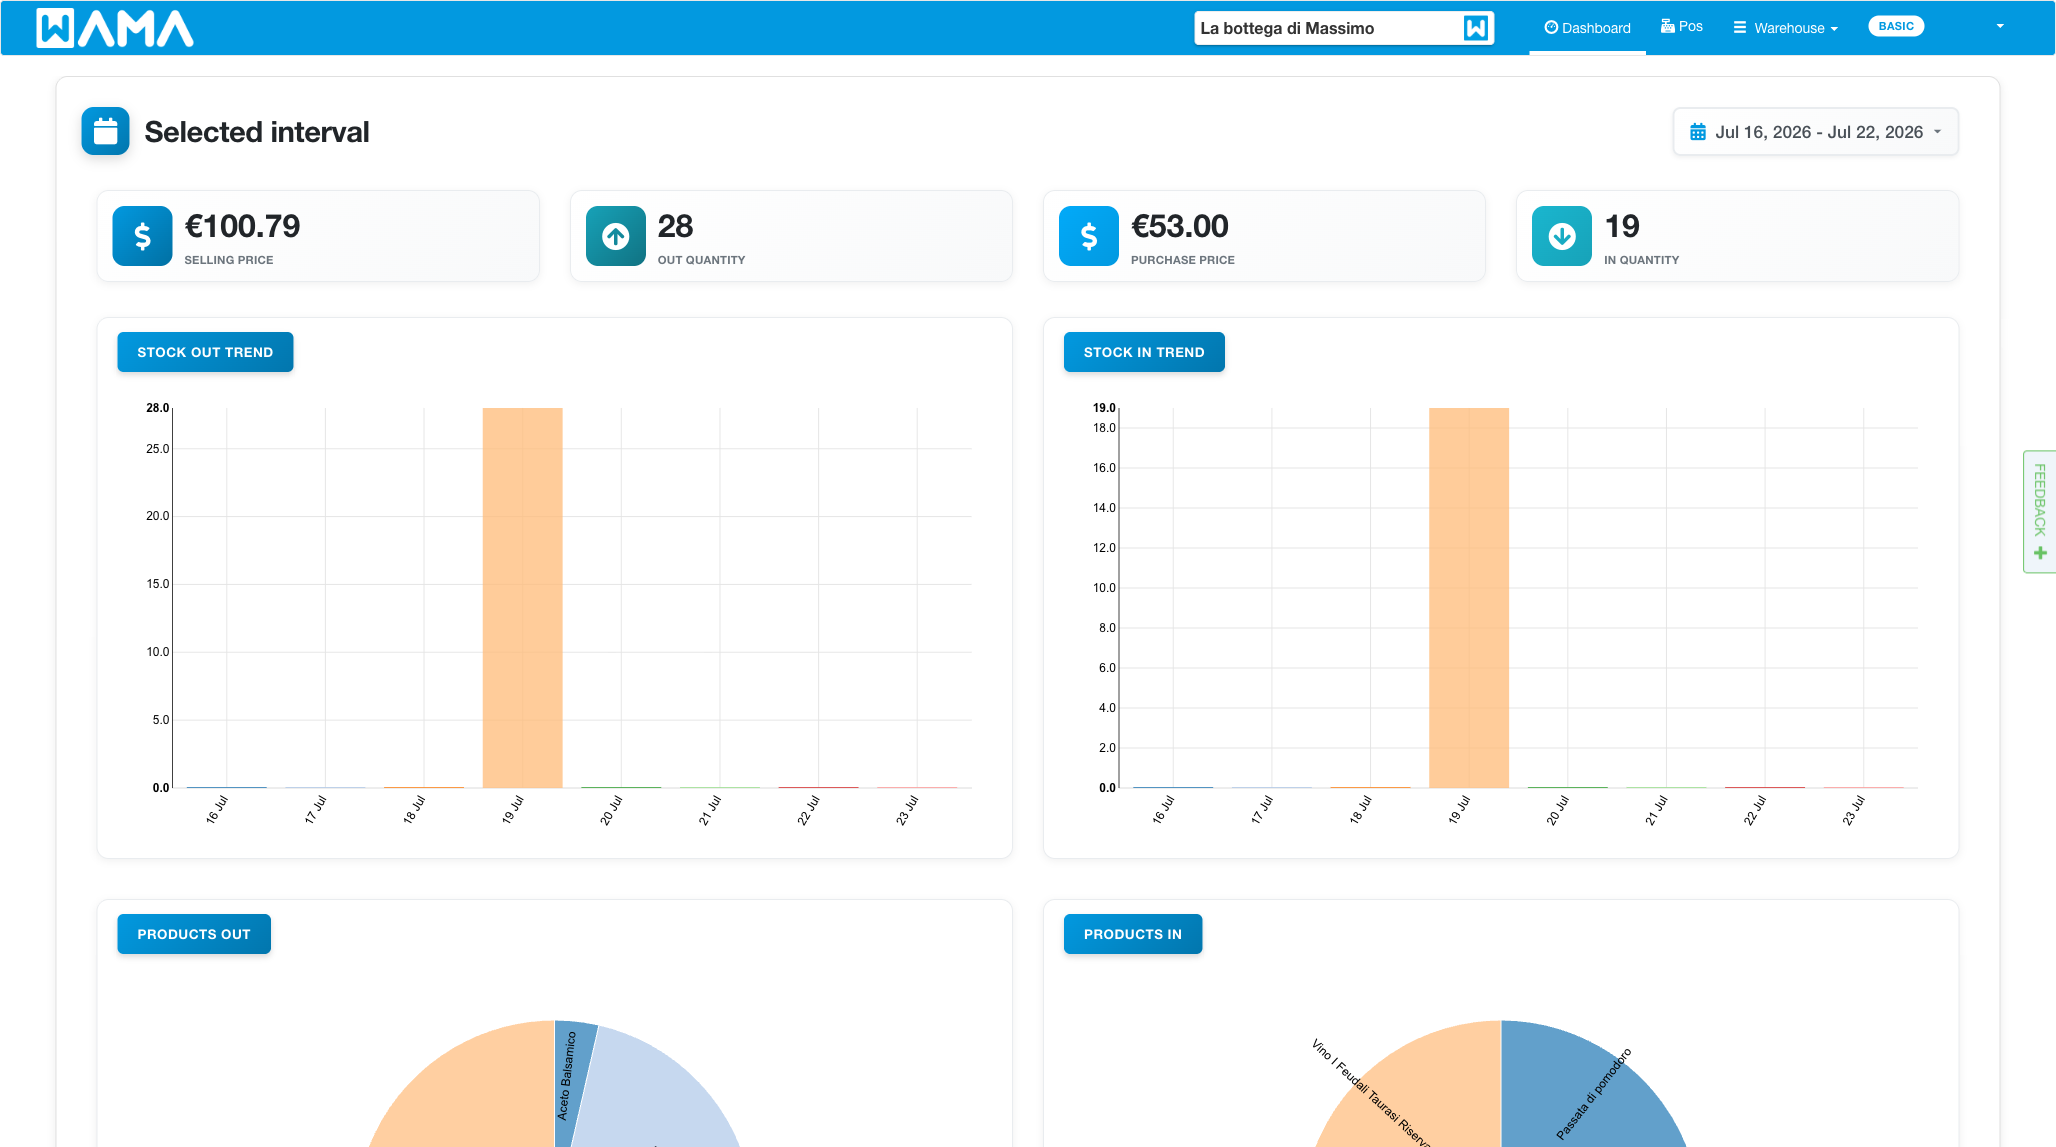
Date range
Select the period used for sales KPIs, trends, rankings, and stock-movement totals: Today, Yesterday, Last 7 days, or a custom range.
Day boundaries follow the timezone set on the warehouse / point of sale (under warehouse settings). If no timezone is set, UTC is used.
Sales figures only include completed sales orders.
Sales and profit
When the Sales orders module is active, the dashboard shows period sales KPIs such as:
- Sales revenue — net revenue from completed sale lines in the period
- Gross profit — revenue minus cost of goods sold, only for lines that have a unit cost stored at sale time
- Margin % — gross profit as a percentage of that costed revenue
- Orders — number of completed sales orders
- Avg order value — sales revenue divided by the number of completed orders
- Days with sales — calendar days in the period with at least one completed sale
Note
Unit cost: Gross profit and margin use the cost saved on each sale line when the order was completed. That snapshot is available for orders completed on or after 25 October 2026. Older sales without cost are left out of margin, so profit can look partial until more recent sales dominate the period.
Charts show Sales revenue and Gross profit by day. Rankings preview Top employees and Top products by revenue (open Reports for the full lists).
Purchases
- POs received — purchase orders marked received or closed in the period
- Purchase value — line value of those purchase orders (not the same as stock-in movements)
Warehouse health
Point-in-time figures for the current warehouse (not limited to the selected period):
- Number of products
- Total quantity (on hand)
- Out of stock
- Selling value — on-hand stock at selling prices
- Inventory at cost — on-hand stock valued at each product’s last purchase price
- Last stock change — how long ago the most recent stock movement was recorded
Stock movements
Period totals for warehouse stock in and out (all movement types — not the same as sales or purchase orders):
- In / out quantity
- Stock in / stock out value — movement price × quantity when a price is present
Daily stock-in and stock-out trends appear on the dashboard charts.
Low stock products
Low stock products lists products whose quantity is less than or equal to the Reorder threshold (up to 20). Use View all low stock products to see the full list.
Set the reorder threshold on each product. See Products.
Products about to expire
When the Expiry dates module is active, the dashboard shows Products about to expire (up to 20): products with stock that are past expiry or within the alert threshold configured in the module settings.
See Expiry dates.
Reports
Open Reports from the main navigation (marked New while the feature is rolling out).
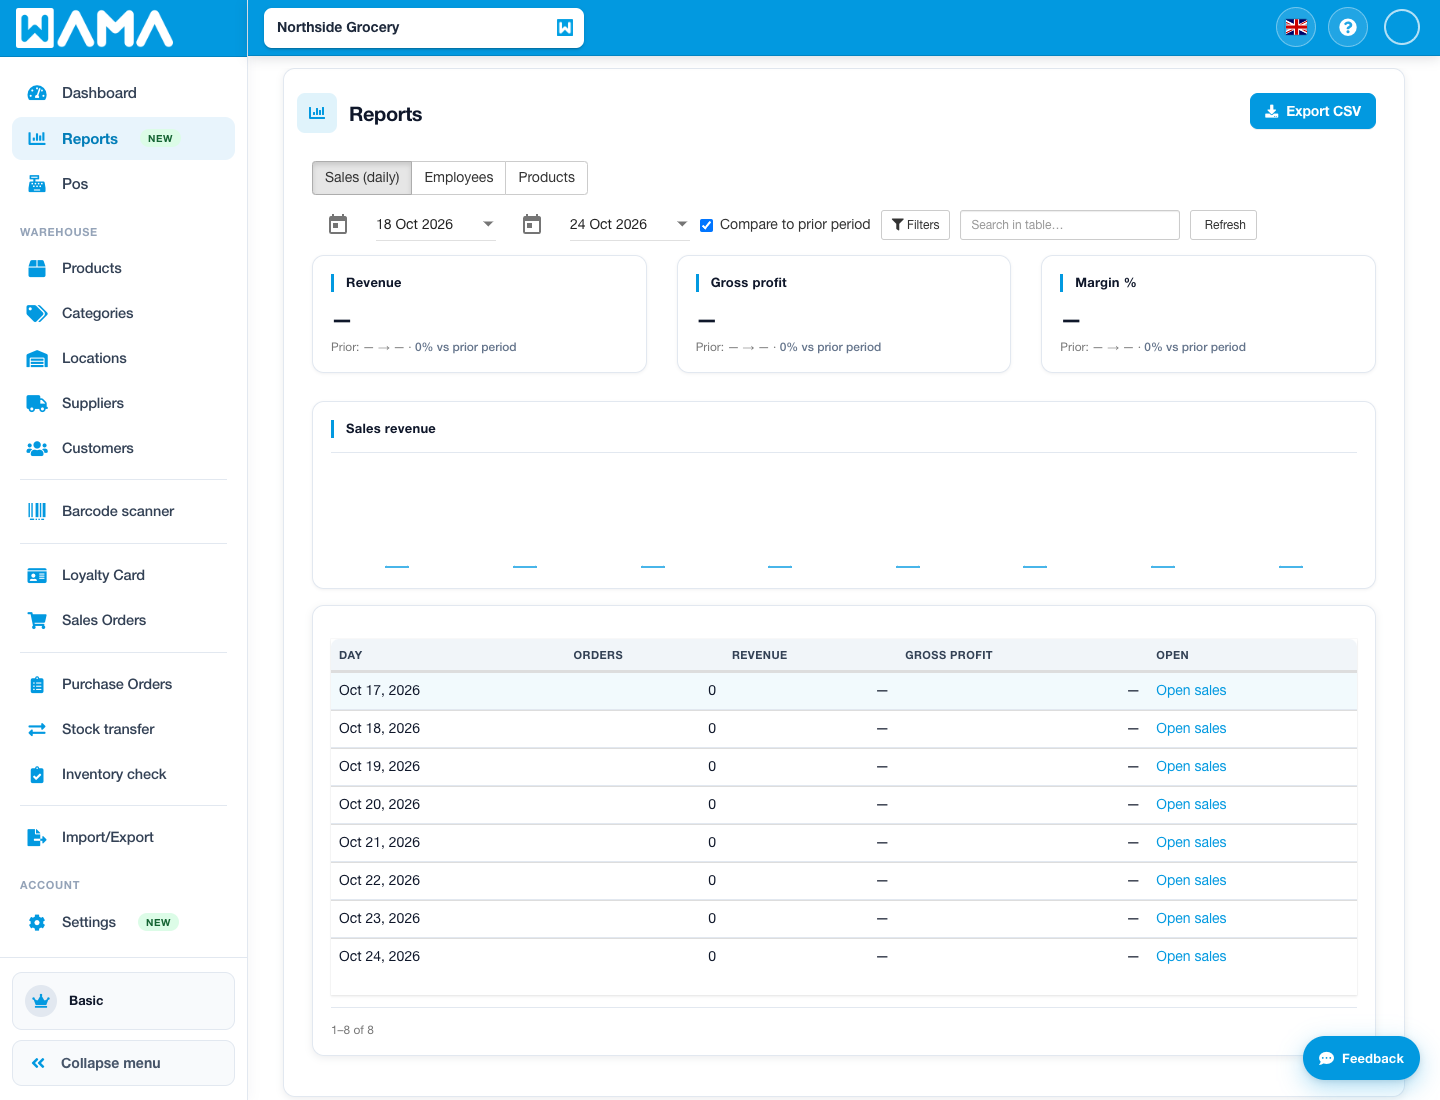
Choose a report type:
- Sales (daily) — one row per day with order count, revenue, and gross profit
- Employees — completed-sales ranking by employee (revenue, orders, and related totals)
- Products — completed-sales ranking by product (quantity sold, revenue, gross profit)
You can:
- Set a Start / End date range (same day-boundary rules as the dashboard)
- Optionally Compare to prior period for revenue, gross profit, and margin
- Narrow results with filters (employee, category, payment method, location, product)
- Sort highest or lowest first, page through results, and Export CSV
Tip
Gross profit on Reports uses the same unit-cost rules as the dashboard. Filters apply to completed sales in the period; warehouse inventory figures on the home page stay warehouse-wide.
Note
Android app: The same Dashboard KPIs, charts, alerts, and Reports (tables, filters, CSV export) are available in the Android app. See Dashboard and reports (Android).